MSE 582 Lecture 12: Analytical Electron Microscopy
MSE 582 Lecture 12: Analytical Electron Microscopy
-
 1. Lecture 12: Analytical electro…
0
00:00/00:00
1. Lecture 12: Analytical electro…
0
00:00/00:00 -
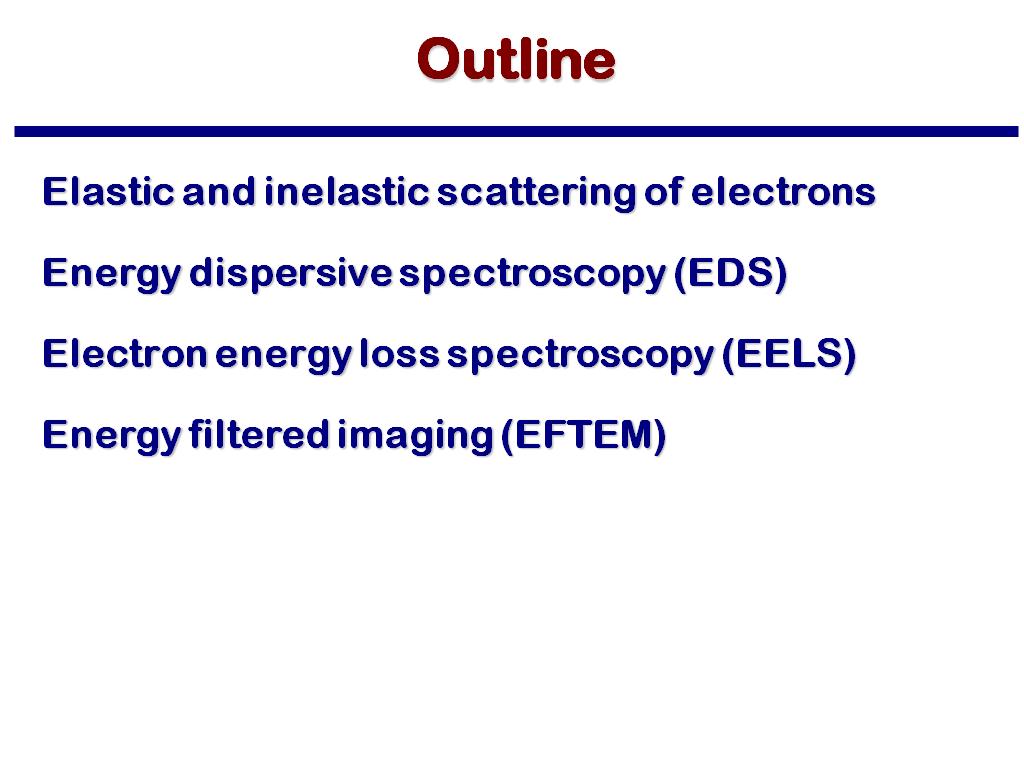 2. Outline
23.189856523189857
00:00/00:00
2. Outline
23.189856523189857
00:00/00:00 -
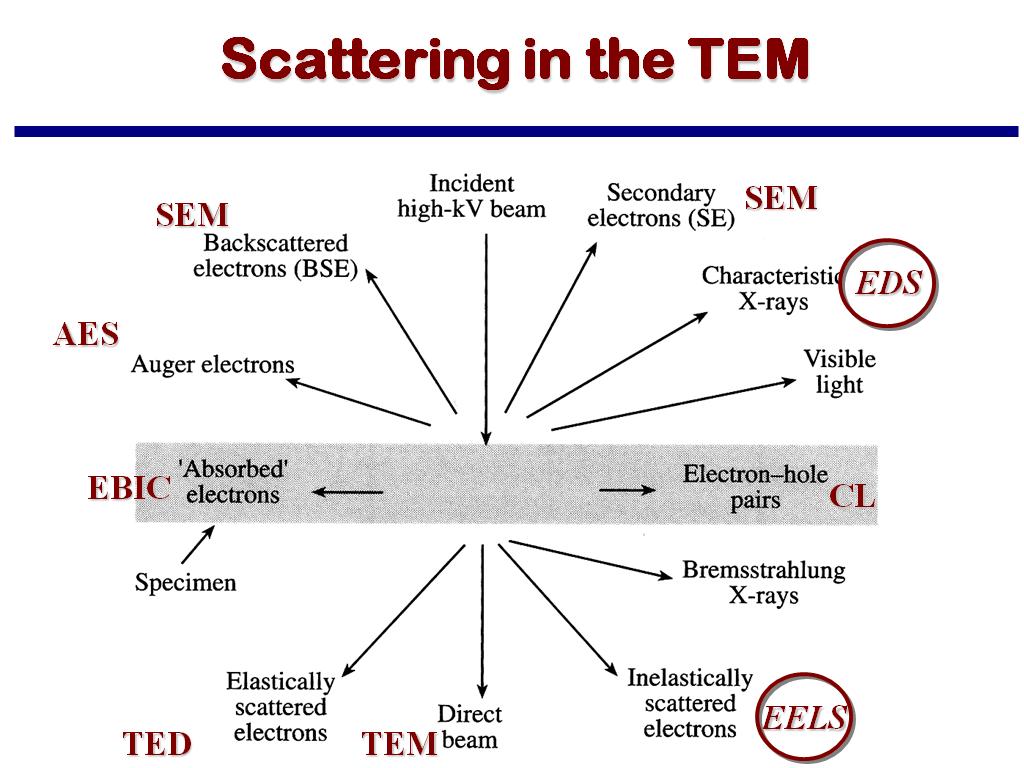 3. Scattering in the TEM
36.803470136803469
00:00/00:00
3. Scattering in the TEM
36.803470136803469
00:00/00:00 -
 4. Energy Dispersive Spectroscopy…
91.4914914914915
00:00/00:00
4. Energy Dispersive Spectroscopy…
91.4914914914915
00:00/00:00 -
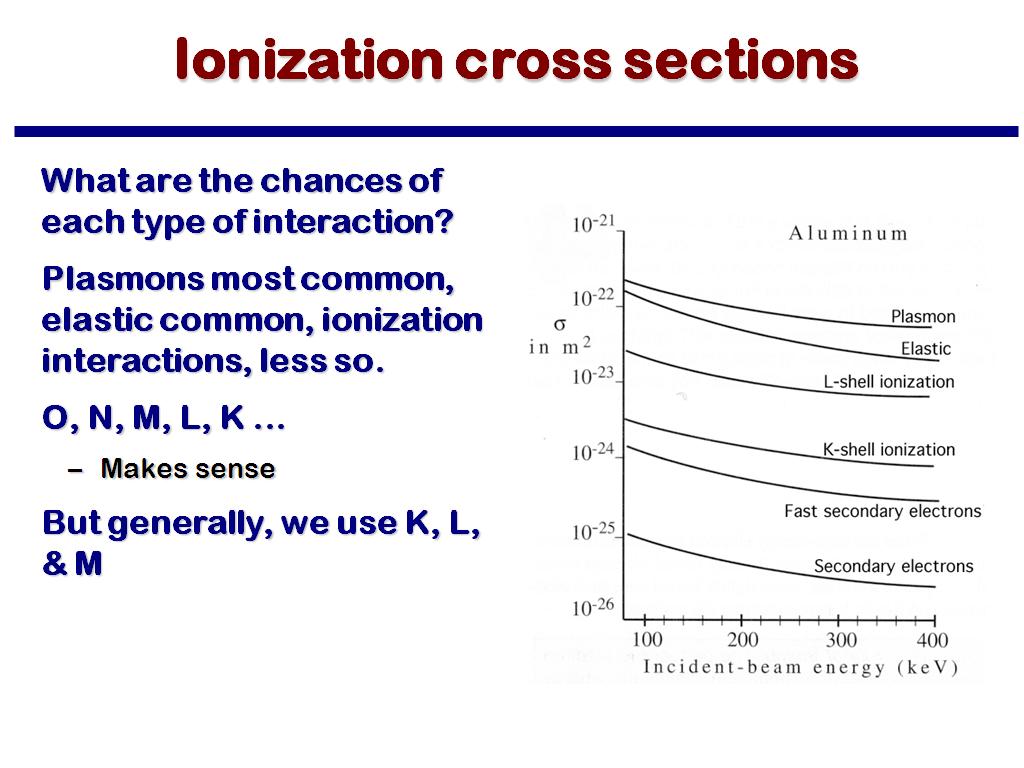 5. Ionization cross sections
98.264931598264937
00:00/00:00
5. Ionization cross sections
98.264931598264937
00:00/00:00 -
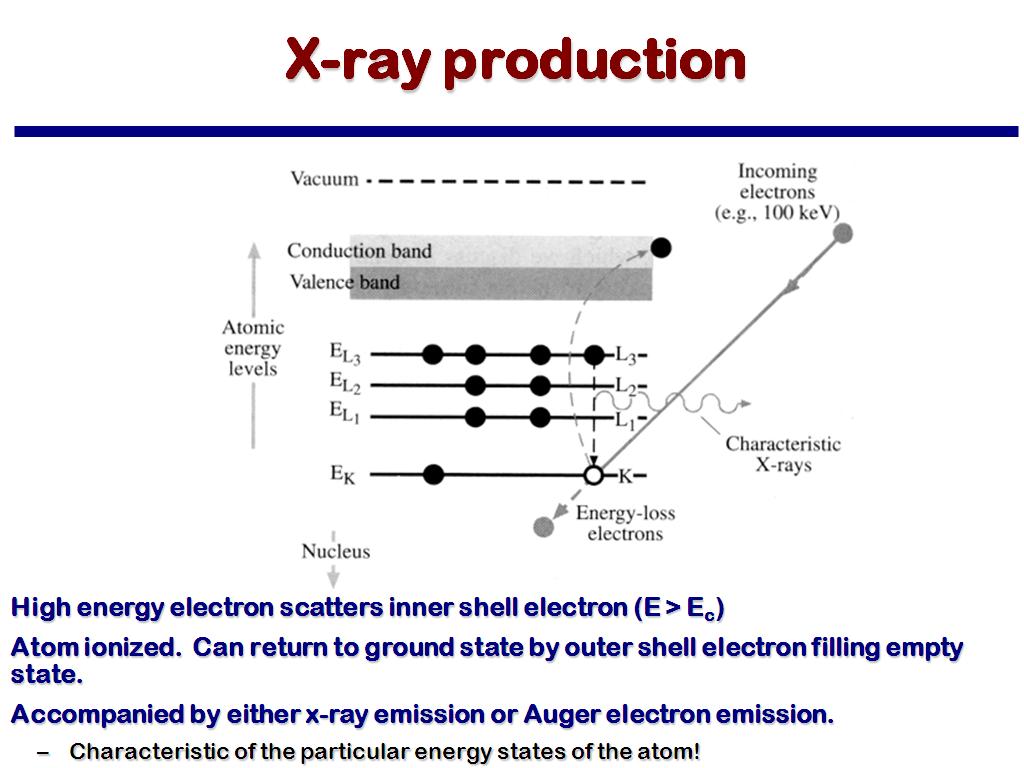 6. X-ray production
143.24324324324326
00:00/00:00
6. X-ray production
143.24324324324326
00:00/00:00 -
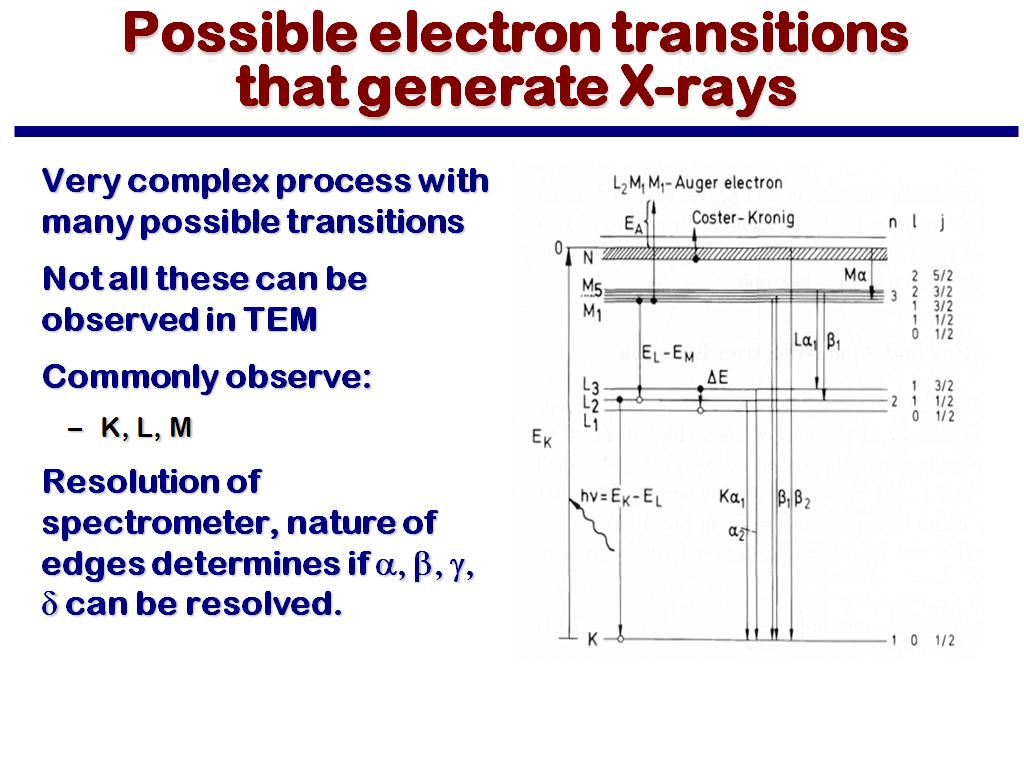 7. Possible electron transitions …
257.15715715715714
00:00/00:00
7. Possible electron transitions …
257.15715715715714
00:00/00:00 -
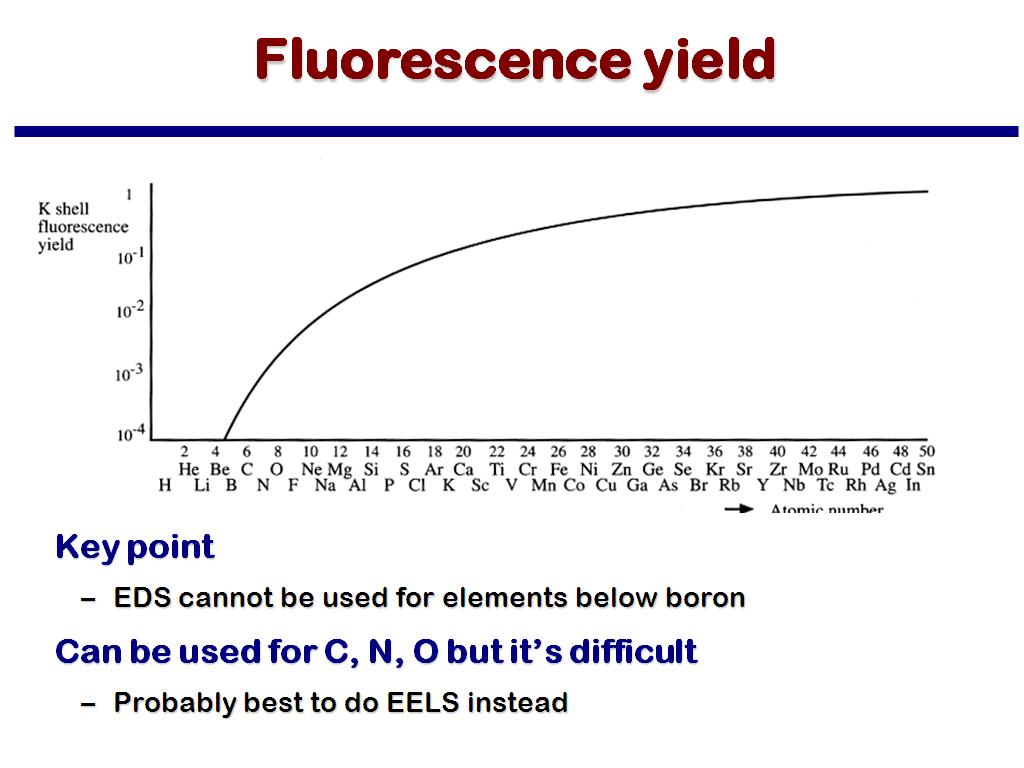 8. Fluorescence yield
318.18485151818487
00:00/00:00
8. Fluorescence yield
318.18485151818487
00:00/00:00 -
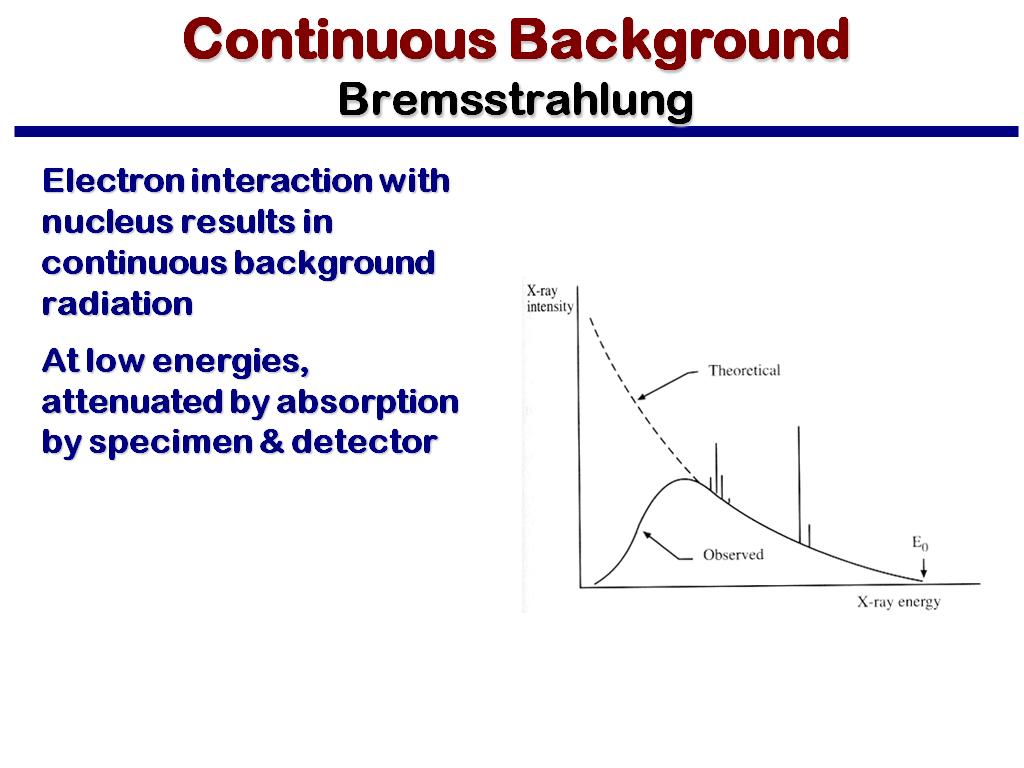 9. Continuous Background Bremsstr…
380.04671338004675
00:00/00:00
9. Continuous Background Bremsstr…
380.04671338004675
00:00/00:00 -
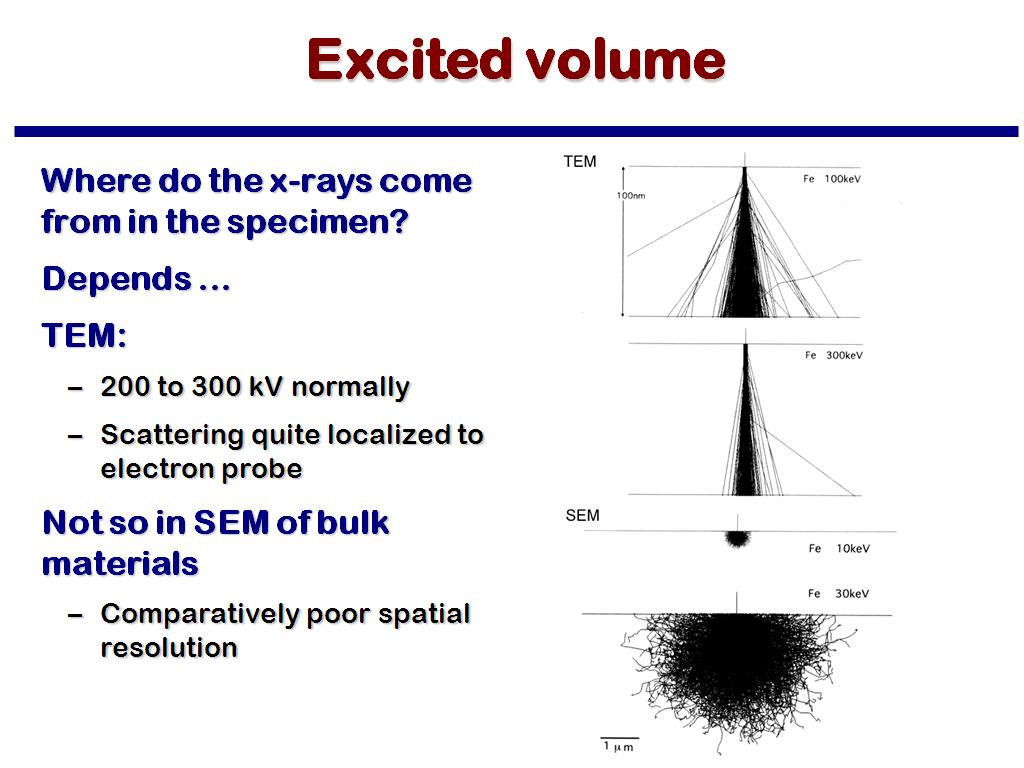 10. Excited volume
439.57290623957294
00:00/00:00
10. Excited volume
439.57290623957294
00:00/00:00 -
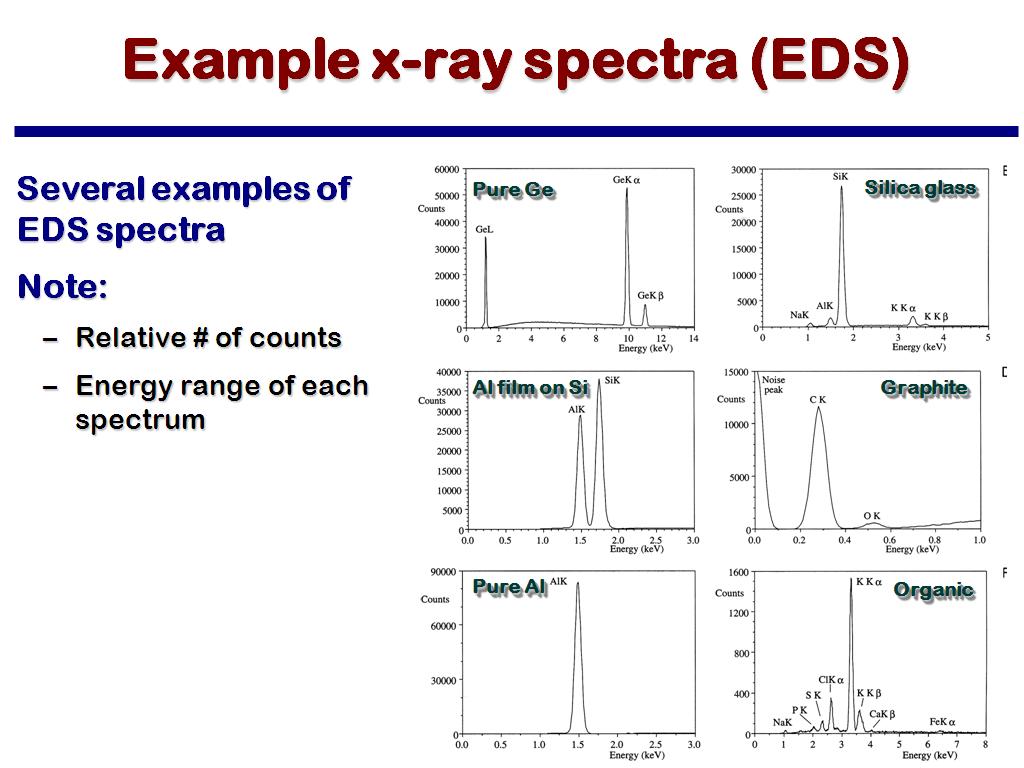 11. Example x-ray spectra (EDS)
604.30430430430431
00:00/00:00
11. Example x-ray spectra (EDS)
604.30430430430431
00:00/00:00 -
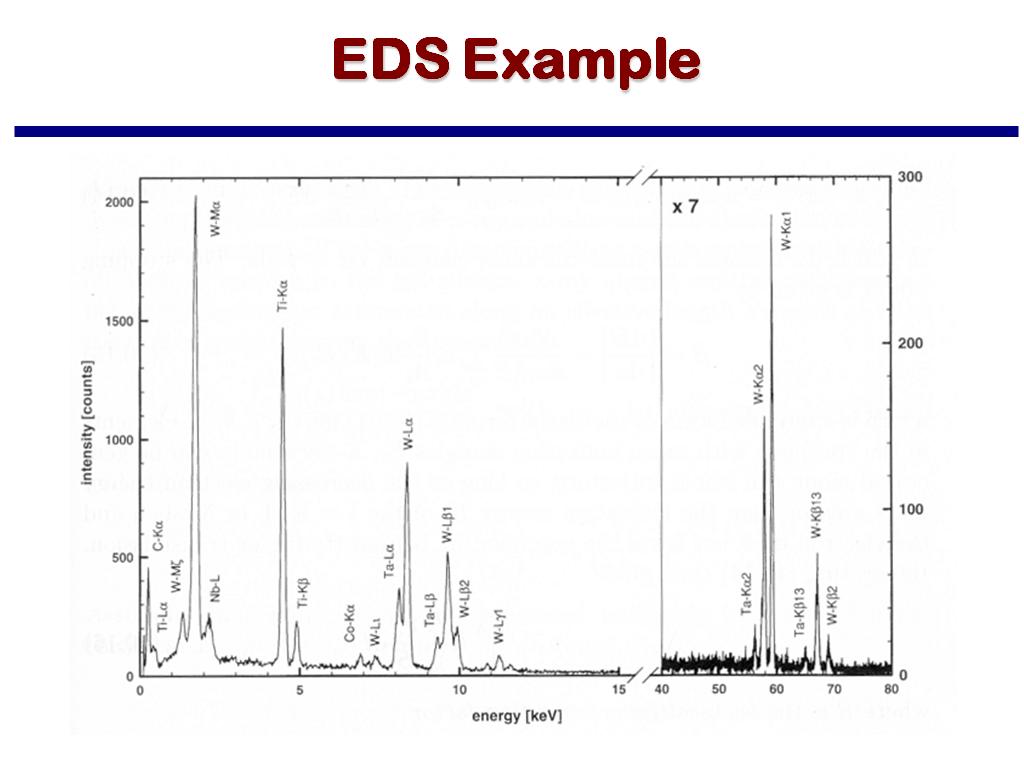 12. EDS Example
854.7547547547548
00:00/00:00
12. EDS Example
854.7547547547548
00:00/00:00 -
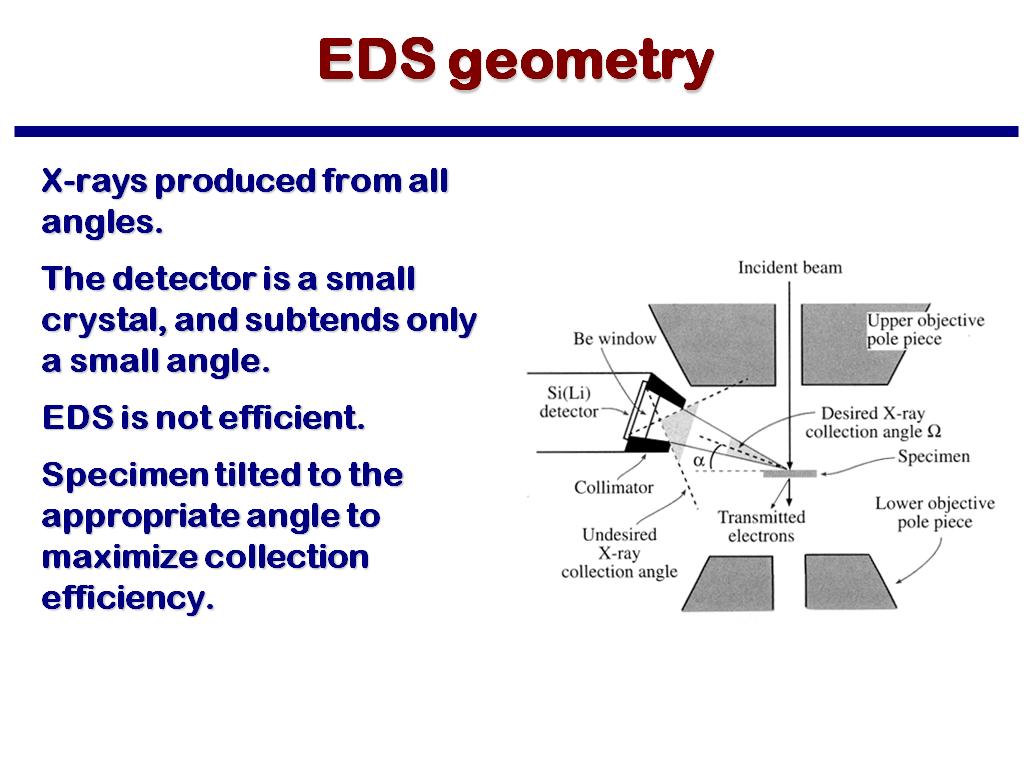 13. EDS geometry
1004.9382716049383
00:00/00:00
13. EDS geometry
1004.9382716049383
00:00/00:00 -
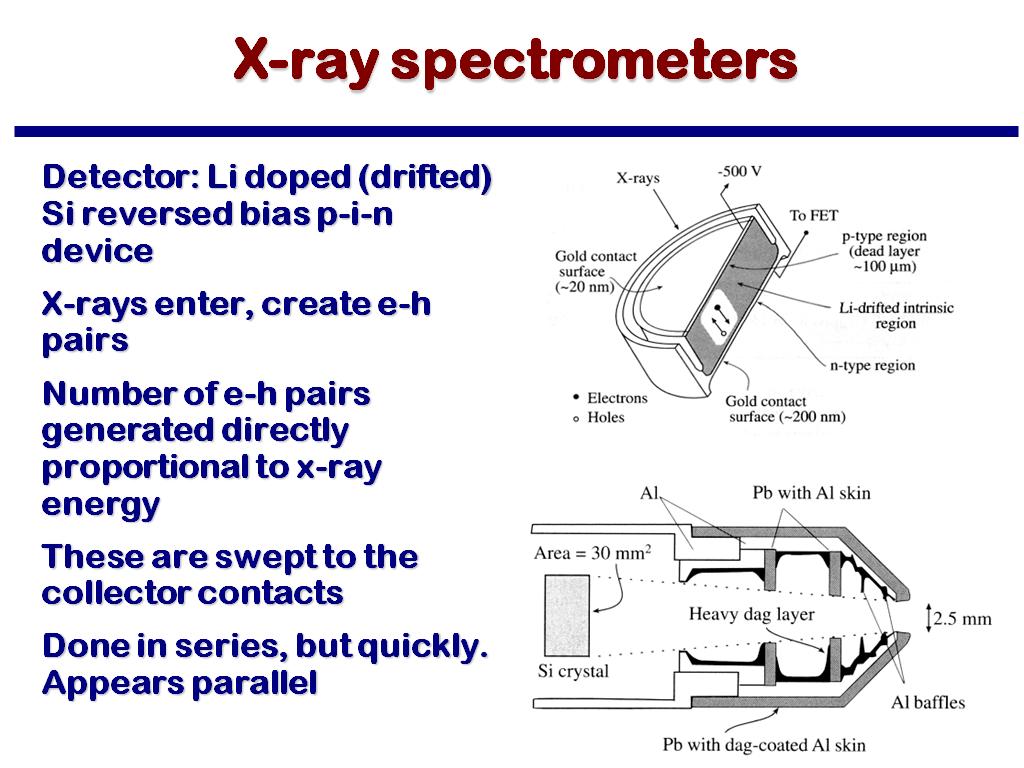 14. X-ray spectrometers
1155.8892225558893
00:00/00:00
14. X-ray spectrometers
1155.8892225558893
00:00/00:00 -
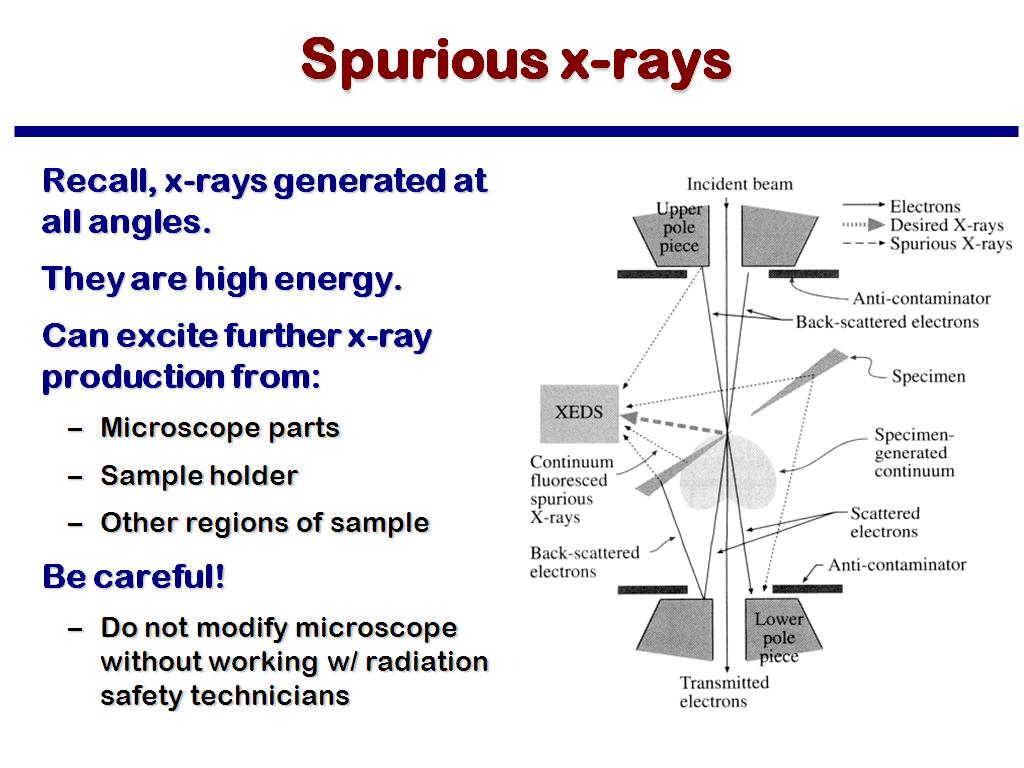 15. Spurious x-rays
1586.7534200867535
00:00/00:00
15. Spurious x-rays
1586.7534200867535
00:00/00:00 -
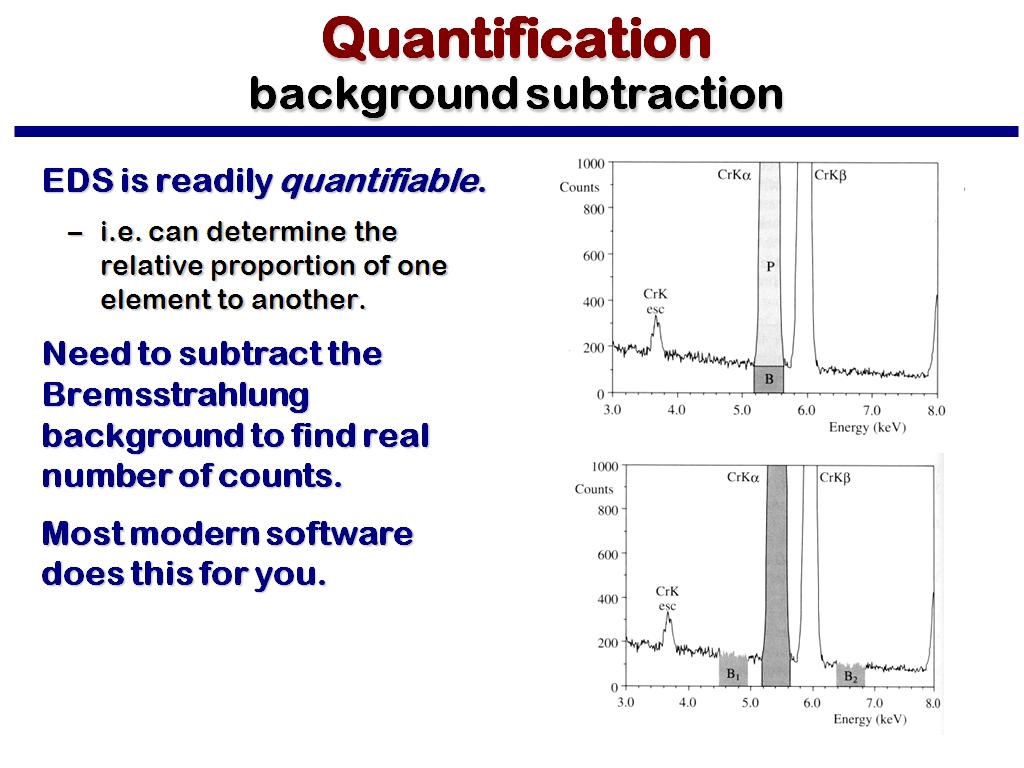 16. Quantification background subt…
1812.7794461127796
00:00/00:00
16. Quantification background subt…
1812.7794461127796
00:00/00:00 -
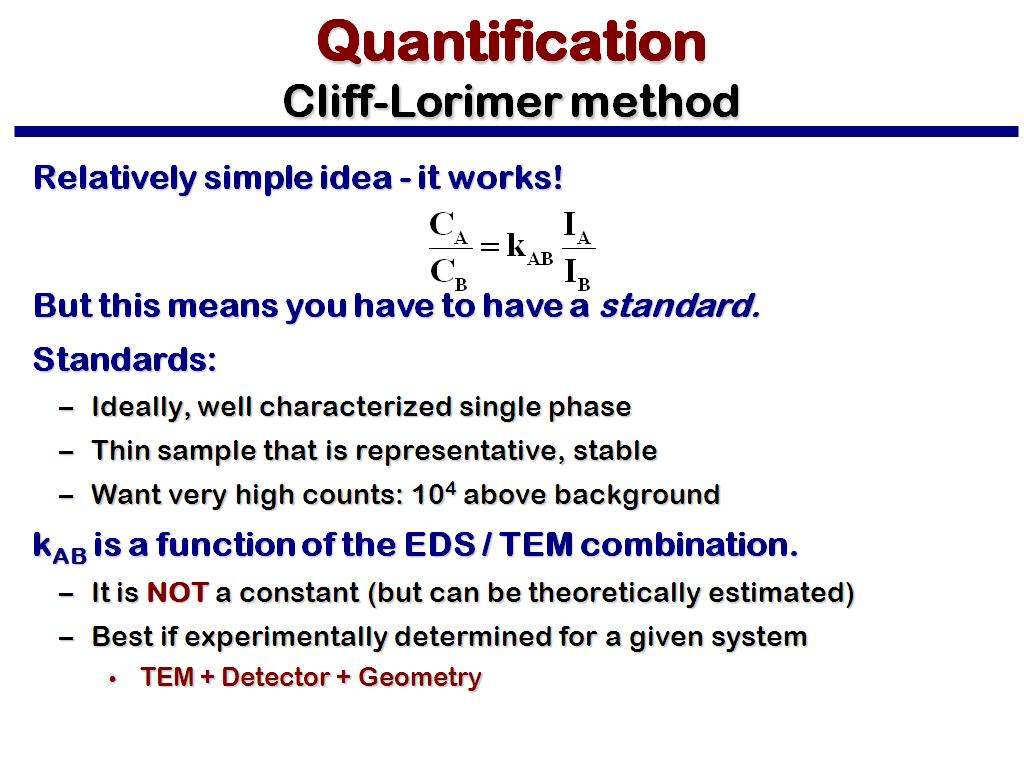 17. Quantification Cliff-Lorimer m…
1853.8204871538205
00:00/00:00
17. Quantification Cliff-Lorimer m…
1853.8204871538205
00:00/00:00 -
 18. Electron Energy Loss Spectrosc…
2027.660994327661
00:00/00:00
18. Electron Energy Loss Spectrosc…
2027.660994327661
00:00/00:00 -
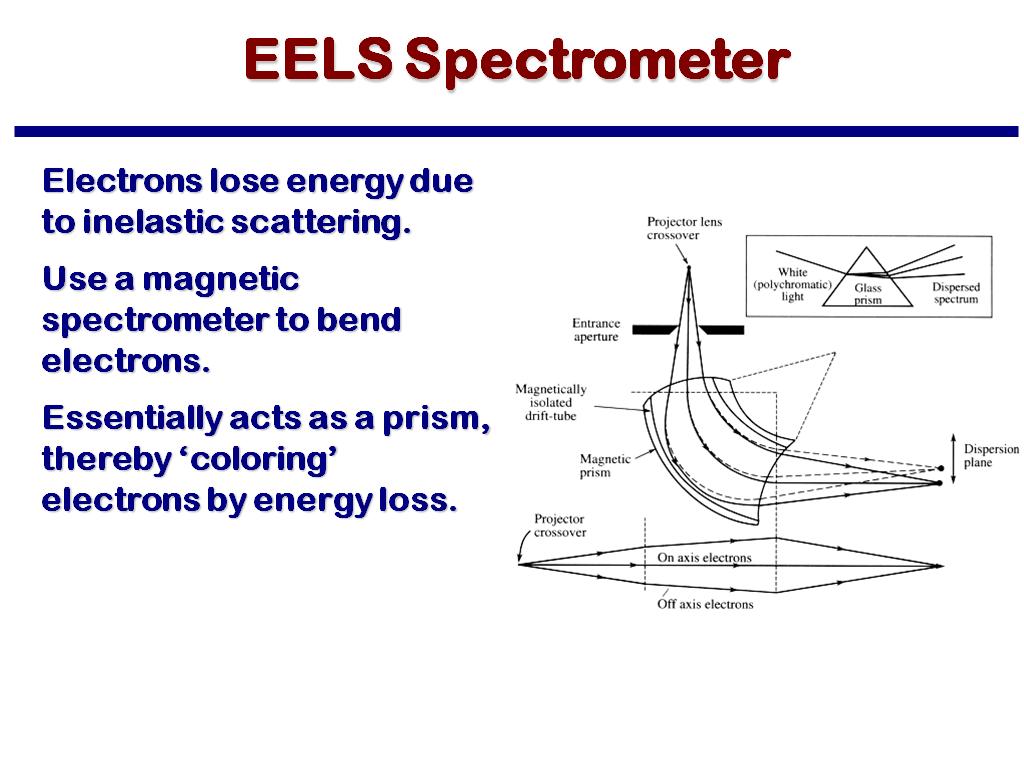 19. EELS Spectrometer
2080.714047380714
00:00/00:00
19. EELS Spectrometer
2080.714047380714
00:00/00:00 -
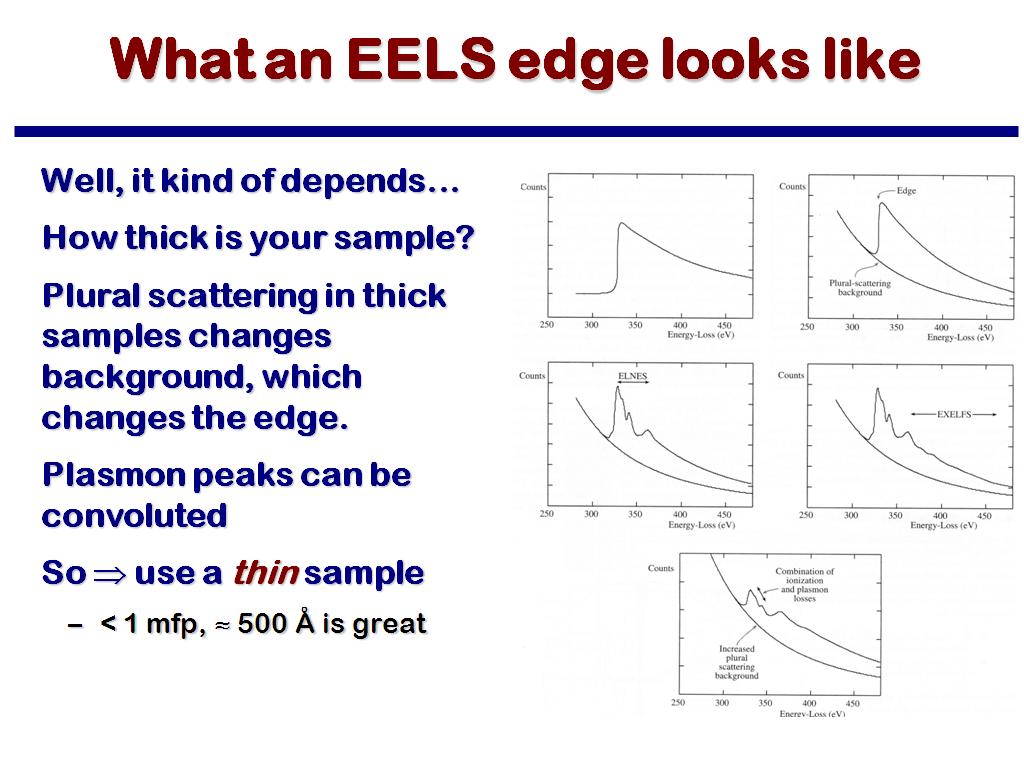 20. What an EELS edge looks like
2141.9085752419087
00:00/00:00
20. What an EELS edge looks like
2141.9085752419087
00:00/00:00 -
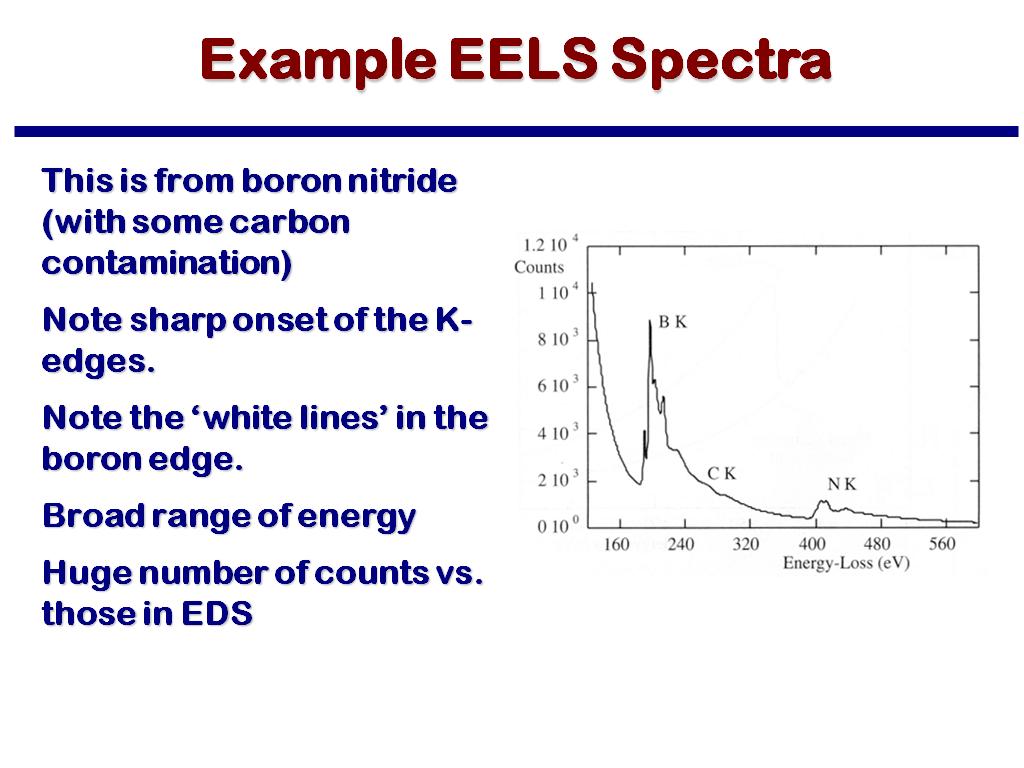 21. Example EELS Spectra
2296.0960960960961
00:00/00:00
21. Example EELS Spectra
2296.0960960960961
00:00/00:00 -
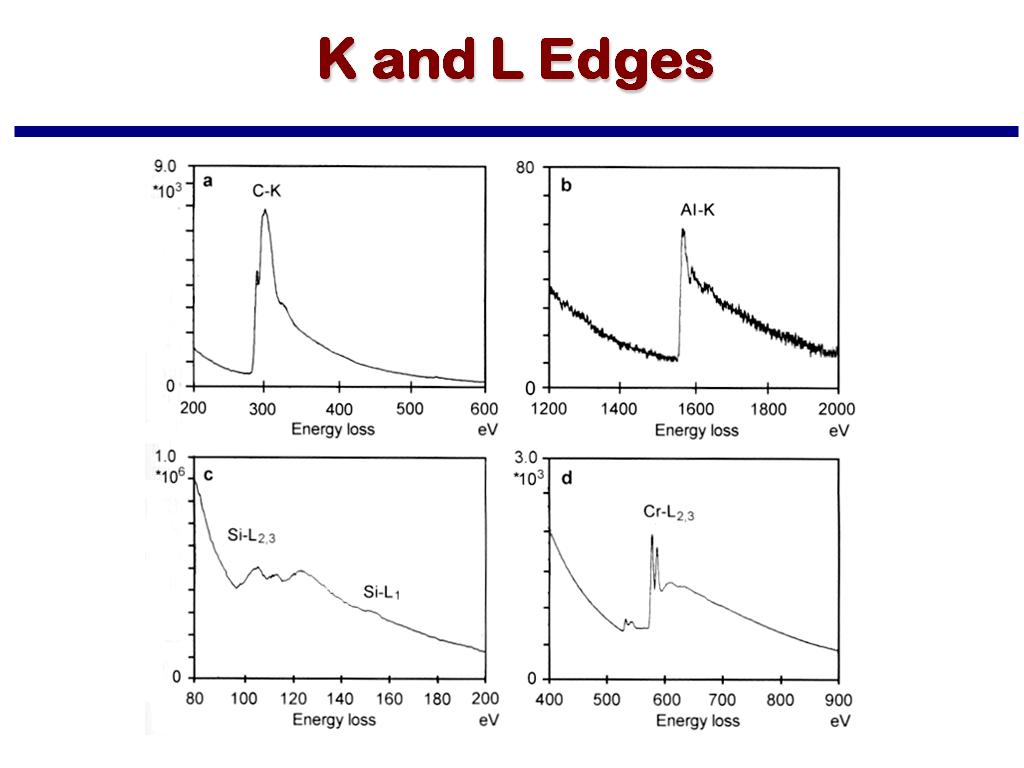 22. K and L Edges
2374.9749749749749
00:00/00:00
22. K and L Edges
2374.9749749749749
00:00/00:00 -
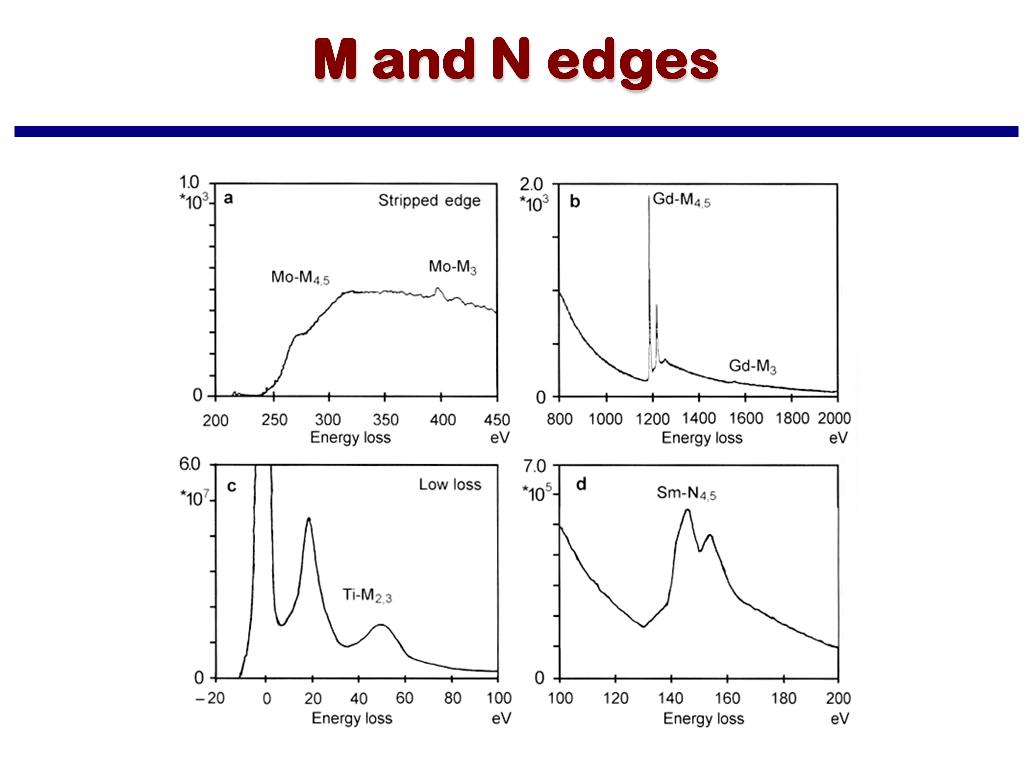 23. M and N edges
2399.6996996997
00:00/00:00
23. M and N edges
2399.6996996997
00:00/00:00 -
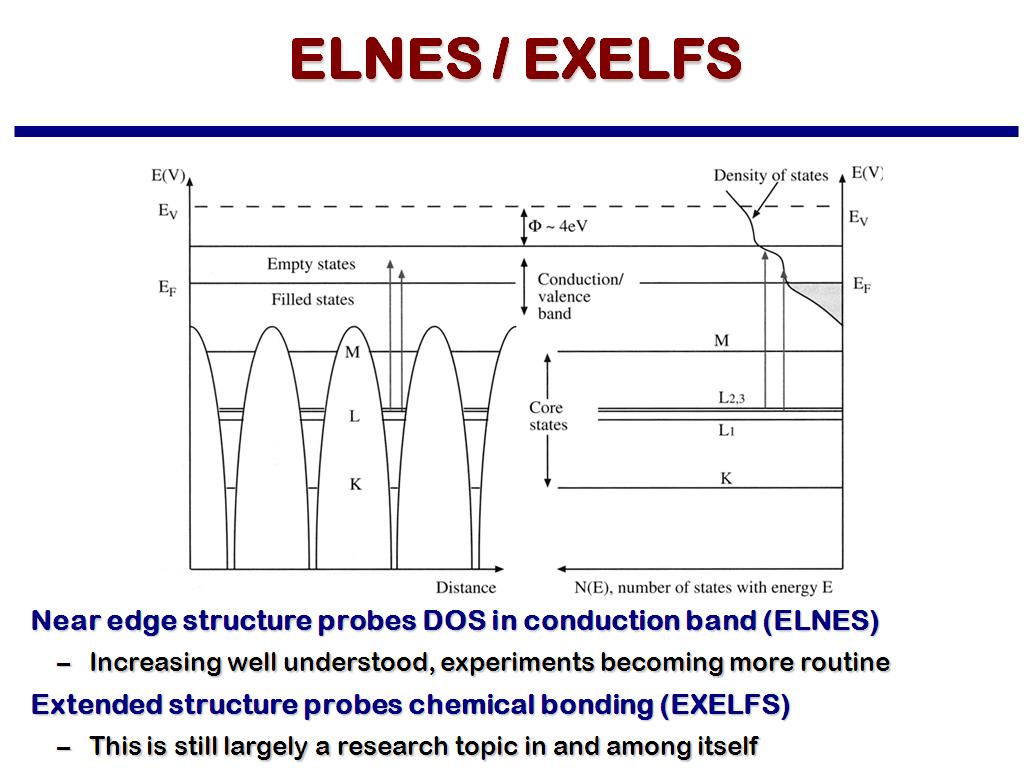
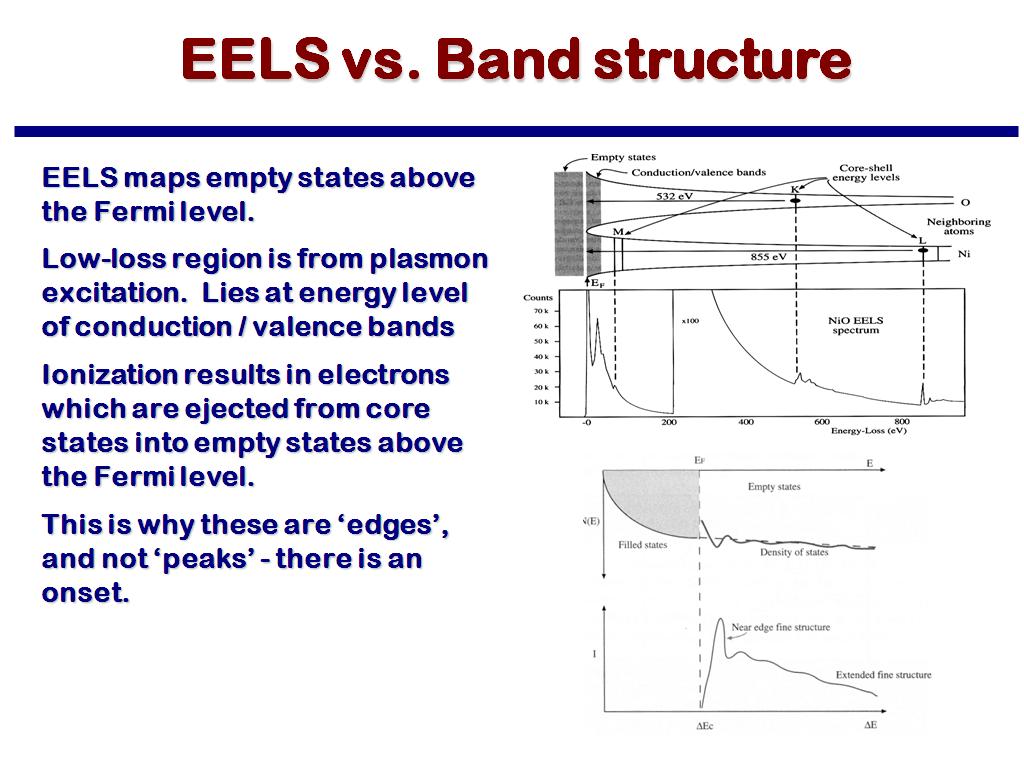 24. EELS vs. Band structure
2418.084751418085
00:00/00:00
24. EELS vs. Band structure
2418.084751418085
00:00/00:00 -
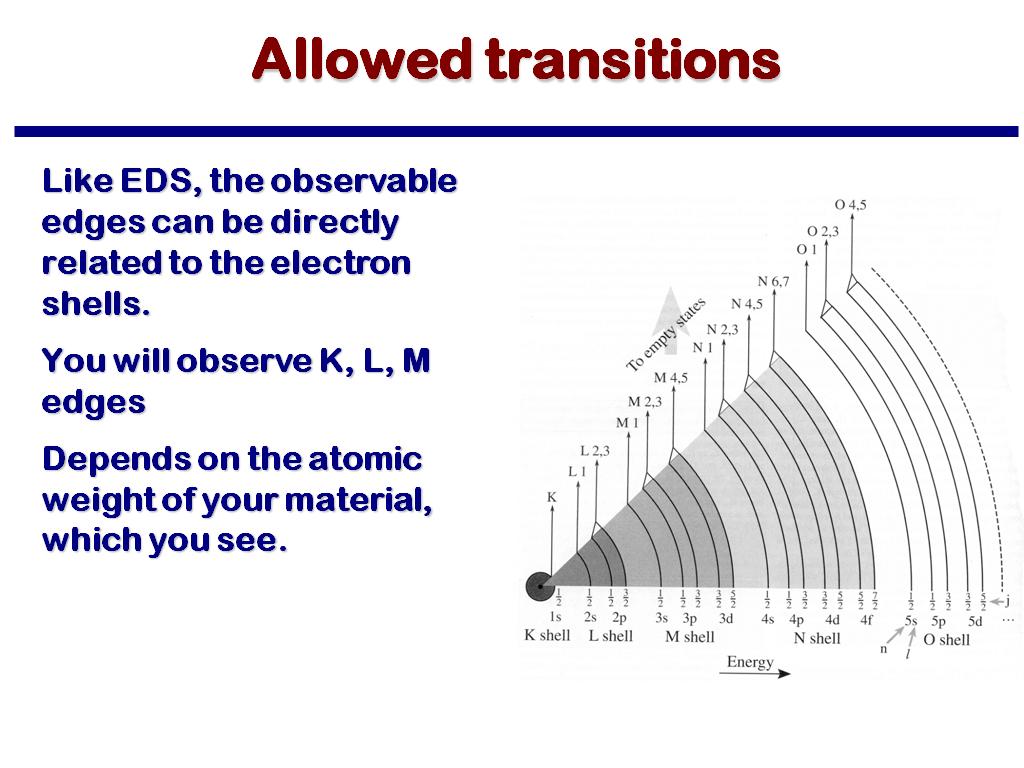 25. Allowed transitions
2488.5885885885887
00:00/00:00
25. Allowed transitions
2488.5885885885887
00:00/00:00 -
 26. ELNES / EXELFS
2491.0243576910243
00:00/00:00
26. ELNES / EXELFS
2491.0243576910243
00:00/00:00 -
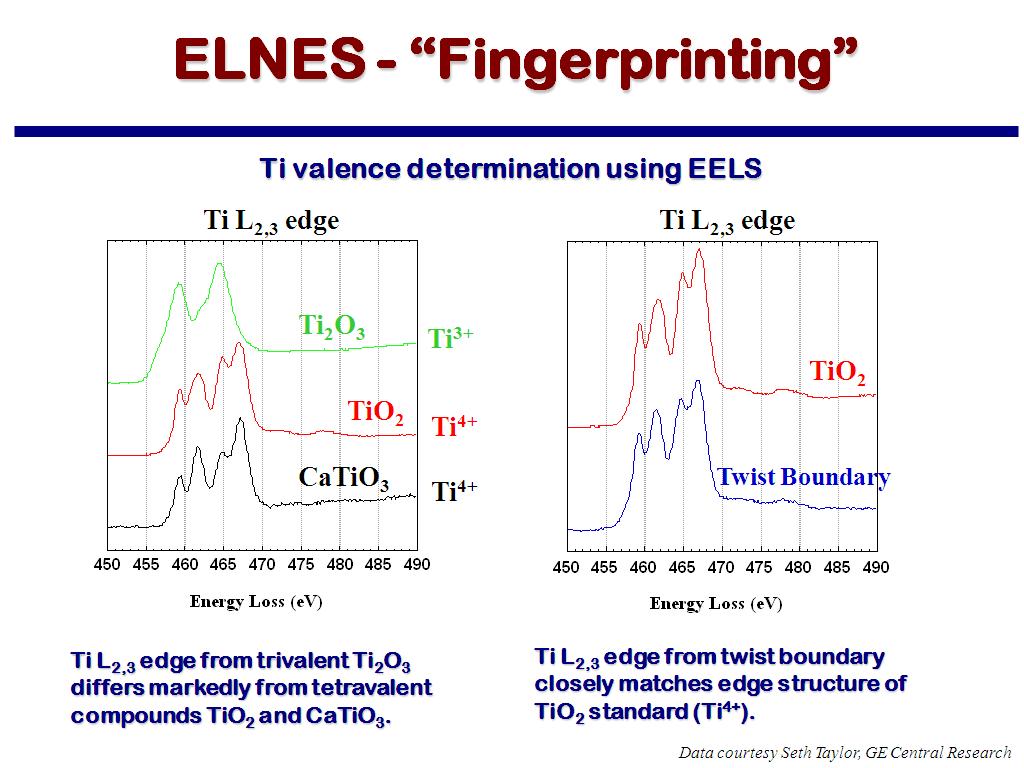 27. ELNES - "Fingerprinting"
2559.2926259592928
00:00/00:00
27. ELNES - "Fingerprinting"
2559.2926259592928
00:00/00:00 -
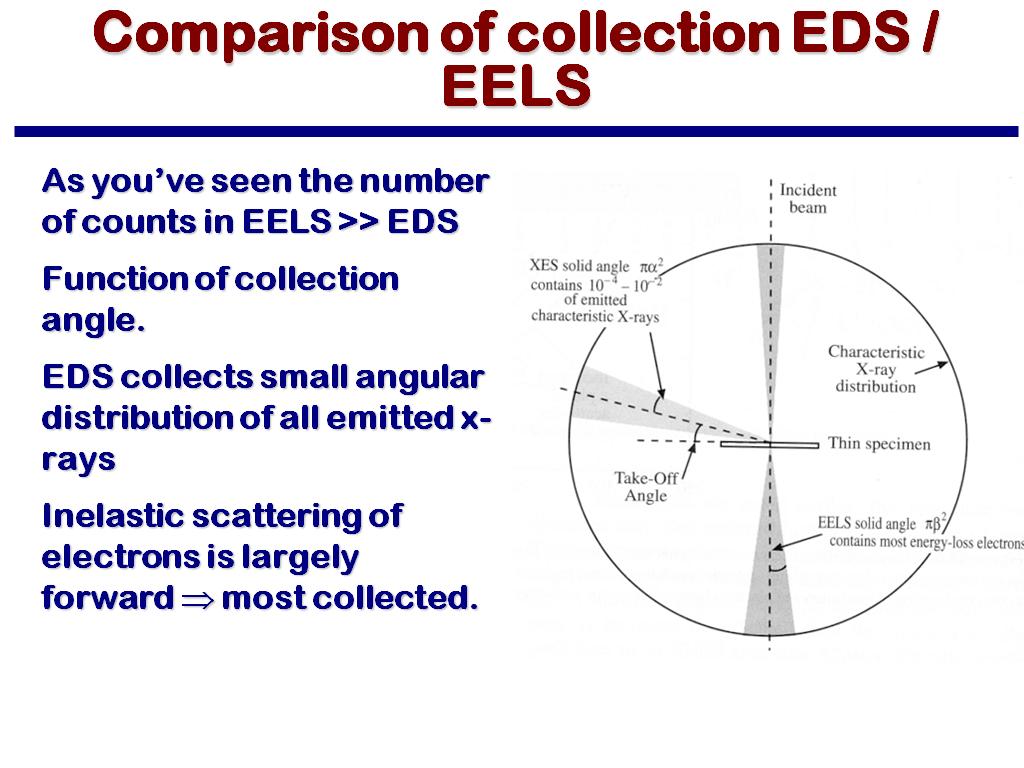 28. Comparison of collection EDS /…
2632.5325325325325
00:00/00:00
28. Comparison of collection EDS /…
2632.5325325325325
00:00/00:00 -
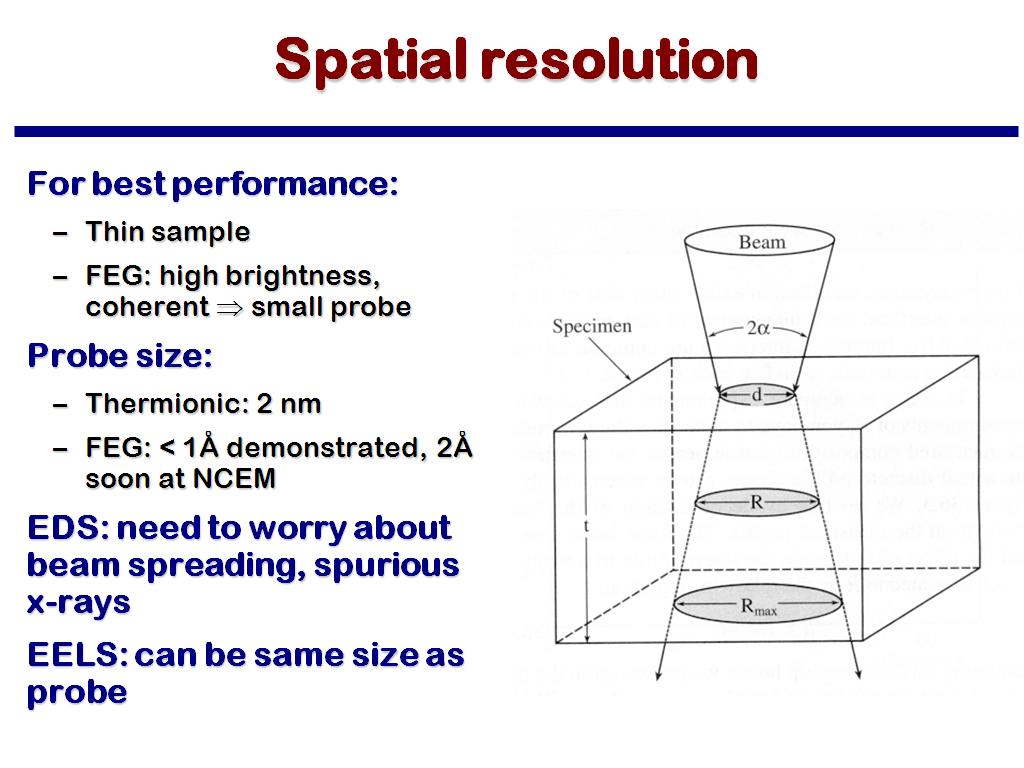 29. Spatial resolution
2694.2942942942946
00:00/00:00
29. Spatial resolution
2694.2942942942946
00:00/00:00 -
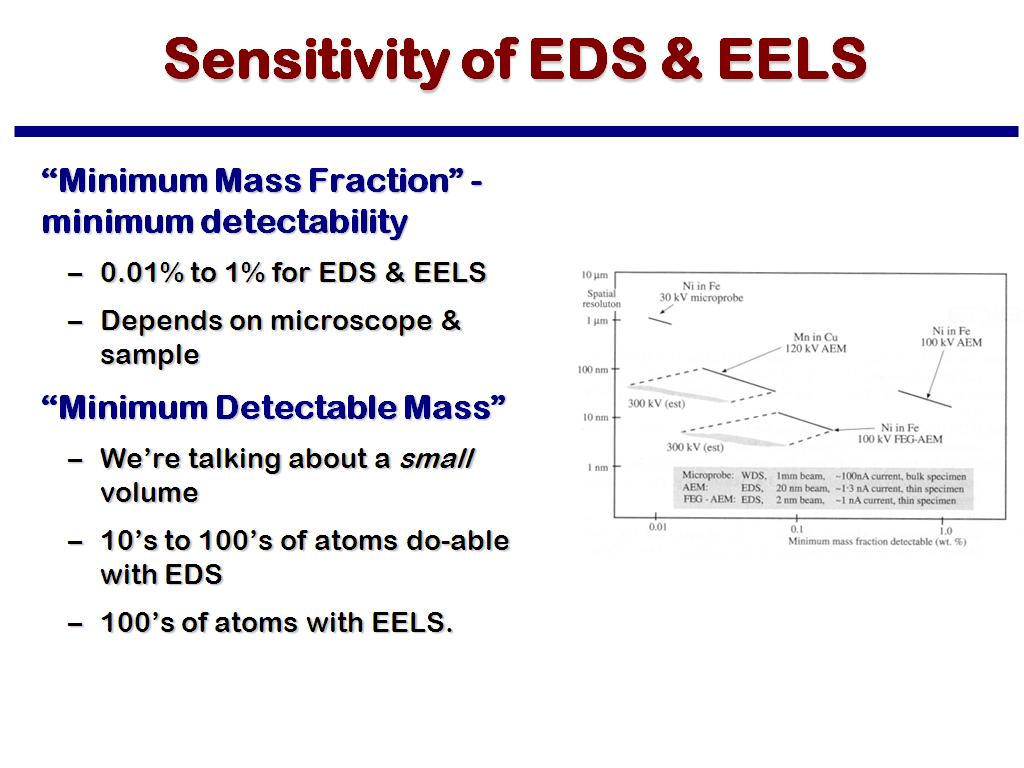 30. Sensitivity of EDS & EELS
2772.405739072406
00:00/00:00
30. Sensitivity of EDS & EELS
2772.405739072406
00:00/00:00 -
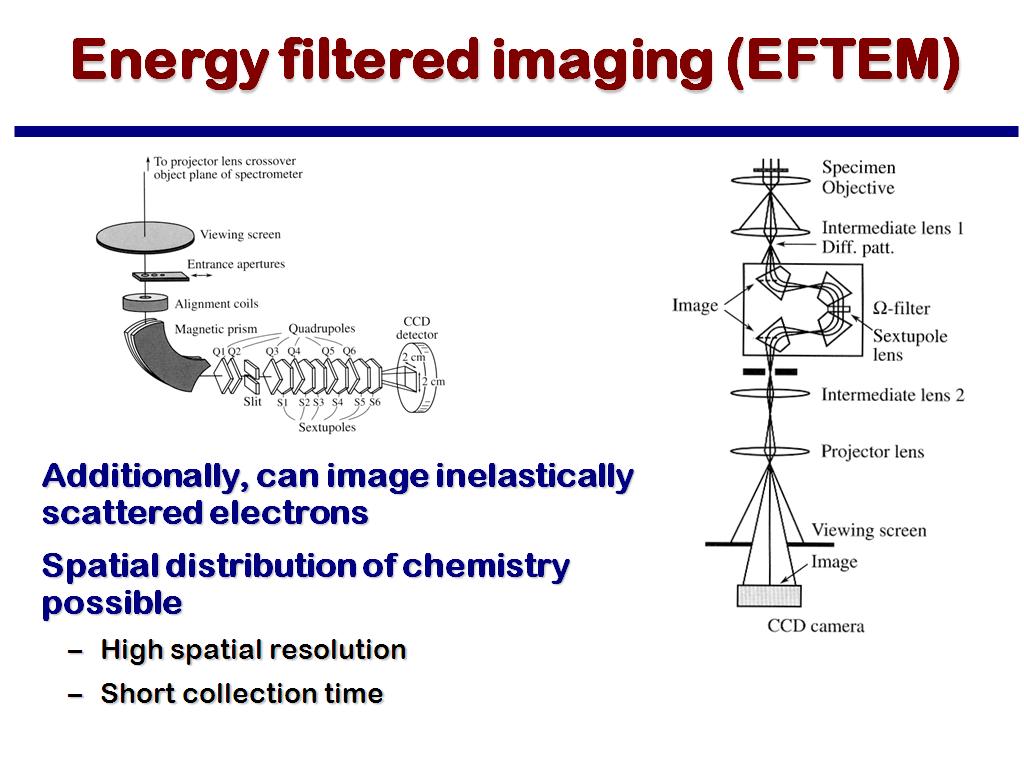 31. Energy filtered imaging (EFTEM…
2848.9489489489492
00:00/00:00
31. Energy filtered imaging (EFTEM…
2848.9489489489492
00:00/00:00 -
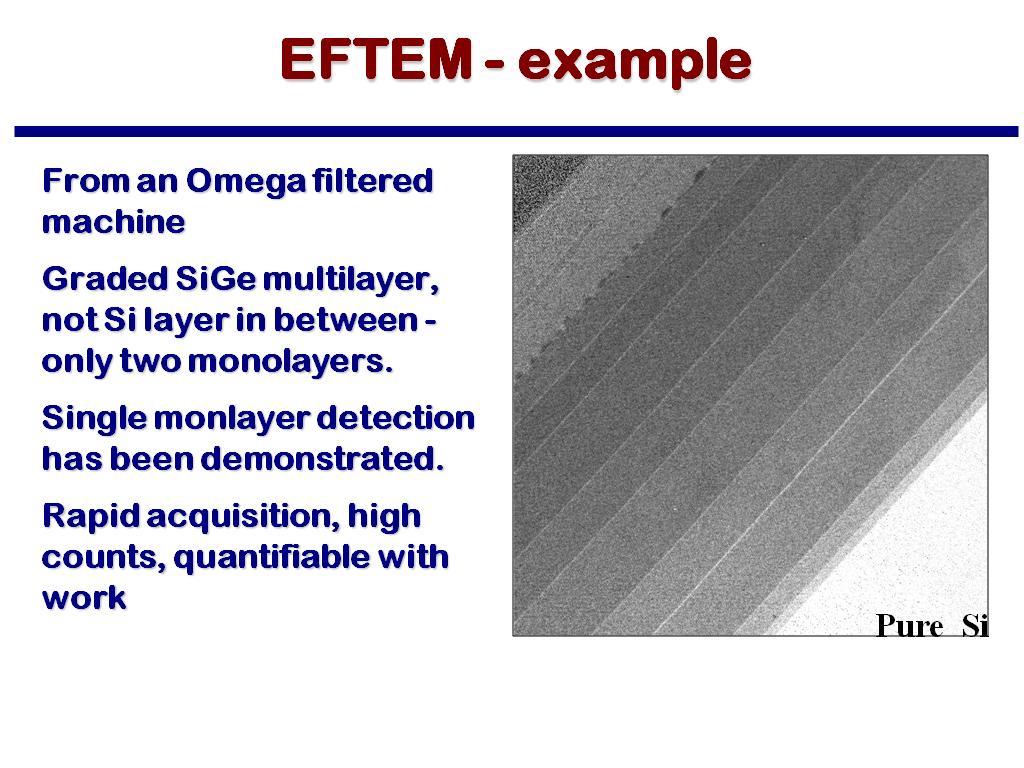 32. EFTEM - example
2903.4034034034034
00:00/00:00
32. EFTEM - example
2903.4034034034034
00:00/00:00 -
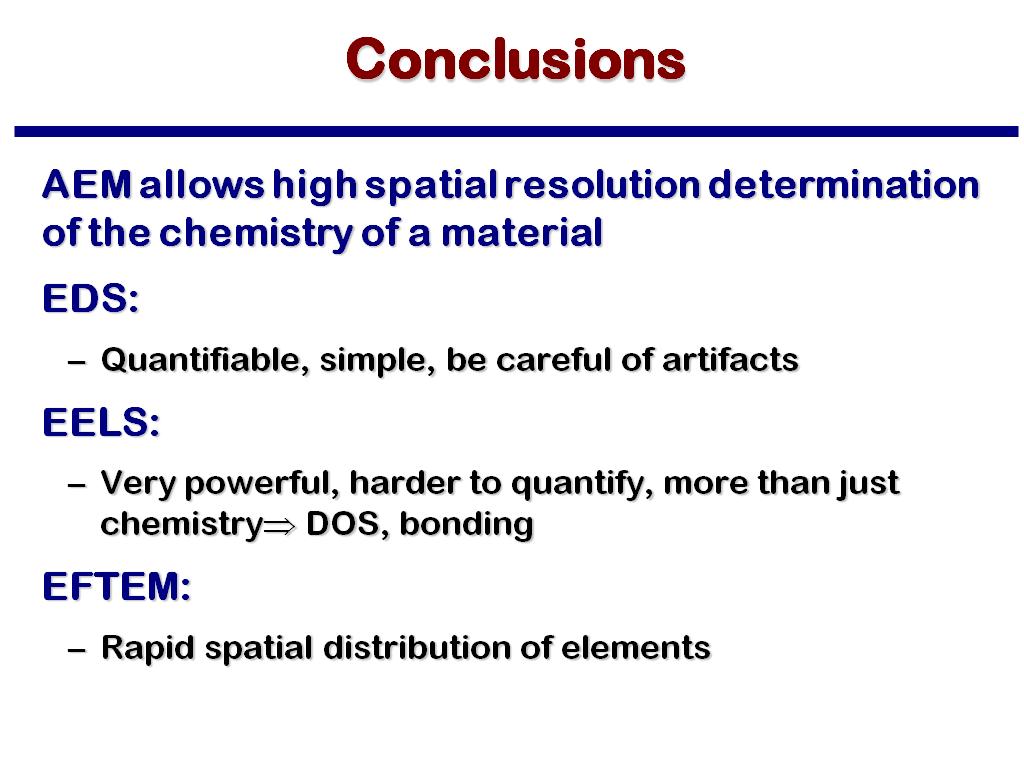 33. Conclusions
2936.1361361361364
00:00/00:00
33. Conclusions
2936.1361361361364
00:00/00:00 -
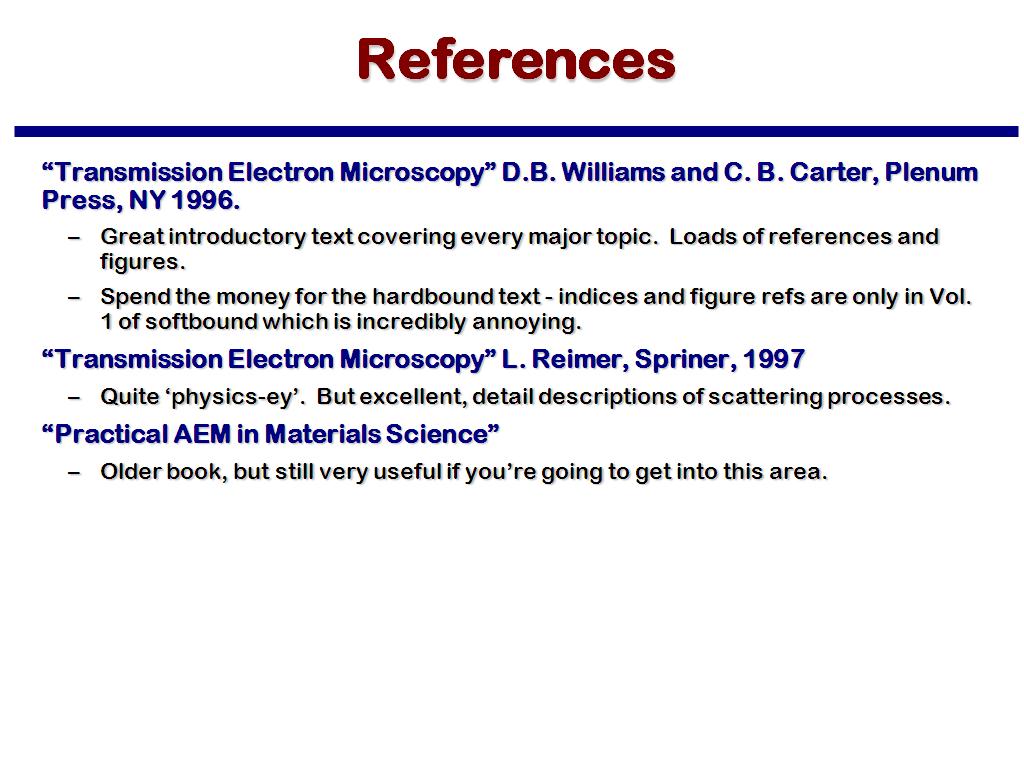 34. References
2958.6586586586586
00:00/00:00
34. References
2958.6586586586586
00:00/00:00